How to generate reports on the performance of different advertising channels? Encyclopedia of Marketing Sample report to the customer on contextual advertising
In this article we will talk about the classic approach to analyzing the effectiveness of advertising campaigns.
When a company spends money to promote its products, it always wants to evaluate the cost-effectiveness. There are many methods and criteria for assessing the effectiveness of advertising and answering the question “How effective is the advertising of my product?” In this article we will talk about the classic approach to calculating and analyzing the effectiveness of advertising campaigns. Using a simple report as an example, we will show how you can calculate and evaluate the effectiveness of advertising for any product, how to prepare the correct analysis for company management and increase the efficiency of advertising costs.
Simple rules for assessing advertising effectiveness
Before moving directly to the description of our example, let's consider the basic rules for assessing the effectiveness of advertising campaigns. There are only five of them: the rule of economic efficiency of advertising, the rule of accuracy and consistency of measurements, the conversion rule, the “worst - best” rule and the rule of honest analysis.
Economic efficiency rule
Any advertising costs must pay off, that is, bring growth or (at least) preservation of profits while increasing sales. Advertising campaigns that result in negative financial results are not effective. Each time, the first step is to calculate the net financial result, i.e. look at profits minus advertising costs and compare them to a period without advertising.
The formula for calculating the cost effectiveness of advertising is a simple ROI formula. It looks like this:
- Revenue (before) is the sales of a product during the period during which the product was not supported by advertising. Calculated in rubles.
- Revenue (after) is sales of goods for a similar period of time, but with advertising support. Calculated in rubles.
- Profitability is the percentage of profit in the price of a unit of goods sold. Calculated in %.
- Advertising expenses are the budget spent by a company on promoting a product.
Note: Formula for calculating profitability: Profitability = (Product price - product cost) / product price.
Rule of accuracy and consistency of measurements
Before launching an advertising campaign, determine the criteria by which you will evaluate and track the effectiveness of advertising. This could simply be an increase in sales, an increase in the turnover of a particular product at points of sale, the number of calls or advertising requests, an increase in knowledge of the product, an improvement in the image of the product, etc.
If you want to run advertising on several promotion channels, make sure you can evaluate the effectiveness of each channel separately. If you do not have such an opportunity, then it is better to launch promotion through each channel sequentially. Otherwise, you will not be able to determine which channel contributed to the increase in sales.
Conversion Rule
Always look at the conversion rate of advertising into actual sales. The conversion rate speaks about the quality of the advertising channel and the quality of the advertising message. At a minimum, two conversion indicators can be distinguished: conversion of ad impressions into calls (clicks, hits), and conversion of calls into sales. The higher the conversion percentage, the more effective the channel.
The "best - worst" rule
Conduct a detailed assessment of the effectiveness of advertising campaigns: analyze the worst and best results, try to understand the reasons for high and low response, so that in the future you can choose only working promotion channels and increase the overall effectiveness of advertising.
Rule of honest analysis
Finally, don't try to embellish the results for management. An effective advertising campaign is not only the result of your professionalism, it is the result of understanding the market and audience. It is not always possible to find the right approach to promoting a product the first time. It is important to be able to recognize failures quickly and propose ways to solve problems, promptly revise marketing plans and adjust advertising budgets. The more honest you are with yourself, the less losses you will incur from ineffective promotions and the faster you will spend your existing budget on increasing sales.
Let's start practicing
In this part of the article we will look at an example of a report on analyzing the effectiveness of product advertising. In your work, you can use the entire report or only part of it. This example was prepared taking into account the need to present the results of work to the company’s management and contains comprehensive information that will allow you to correctly explain and justify the use of the advertising budget. The report consists of two parts: the first part is intended to determine the effectiveness of specific activities carried out, the second part is an annual report analyzing the effectiveness of product advertising.
Part one: analysis of the quality of the advertising campaign
This report is used when it is necessary to report on the effectiveness of specific advertising campaigns. It consists of three parts, each of which has its own purpose and tasks.
1. Summary flowchart of advertising activities for the period
In this part of the report you show what promotional activities were carried out during the analyzed period. The best way to show this is in the form of a flowchart indicating itemized expenses. In this case, the advertising budget item refers to the advertising channel. For example, a television commercial, press advertising, contextual advertising, e-mail newsletters, outdoor advertising. If you used different advertising messages in any channel, then it is logical to separate them. For example, e-mail newsletter 1 and e-mail newsletter 2.
In the last columns of the table, compare planned and actual expenses. This will show how much the allocated budget has been spent. Describe the main reasons for the deviation of fact from plan. If there were significant savings, be sure to indicate this fact and write how it was achieved.
2. Analysis of sales dynamics

Be sure to write down your conclusions according to the graph: Was there an increase in sales? By what percentage did sales increase? How quickly did the advertising campaign affect sales? Which activity had the most impact?
3. Analysis of the effectiveness of advertising costs
The last step of the report is to evaluate the economic efficiency of the advertising campaign. Compare the main financial indicators for three periods: before, during and after the advertising campaign. Analysis of sales after an advertising campaign is important because it evaluates the long-term effect of advertising. Some communication channels are too expensive to pay off in the short term (for example, display advertising), so it is better to look at the long-term effect of sales growth. In such an analysis, it is important to take periods of equal time (1 month, 3 months, etc.).

Be sure to write conclusions for all tables. The conclusions will help management correctly understand the calculations and see important points: Which channels were the most effective? Why? Which ones had high response but low conversion? What needs to change to improve the situation? Which channels should be abandoned in the future and how should the budget be revised?
Part Two: Annual Advertising Performance Report
1. Analysis of financial indicators
The first part of the annual advertising performance report should show the overall financial result compared to the previous year. Here it is important to compare such indicators as sales, profit, profit-advertising costs, . If you can evaluate the dynamics of product knowledge, this will be a definite plus for the report.

2. Budget distribution
The next step in the annual report is to assess budget allocation. It shows how much was spent and highlights the most significant cost items.

Be sure to write justifications for significant deviations in advertising cost items.
3. Analysis of the effectiveness of individual articles
The final step of the annual report is to provide a consolidated item-by-item analysis of the effectiveness of the funds spent. Evaluate the effectiveness of each communication channel through which advertising support for the product was carried out. For each cost item, evaluate response rates, conversion rates, and ROI.
The solution is a one-page table with the main indicators of the advertising campaign "to keep your finger on the pulse". Developing a page like this will take you 10 minutes, but will save you many hours in the future. These are exactly the ones we have implemented for our clients.
What is Google DataStudio
This is a data visualization tool that allows you to download data from different sources and summarize it into online reports, and then share it in the best traditions of Google Docs.
- Key indicators, for example, a profit report by social networks, etc., to “keep your finger on the pulse.”
- Medium depth, for example, a report on advertising campaigns or product categories by Yandex.Direct.
- In-depth, such as cohort analysis or conversion by URL nesting, such reports need to be compiled manually.
So in Data Studio it is advisable to build reports only by main indicators.
At the time of writing, only beta is available with limitations:
- It does not allow you to aggregate data from different sources, for example, take the number of clicks on dates from Google Analytics and combine them with the number of calls on the same dates from a regular table in Excel.
- In our country it is not yet possible to use the high technologies of Data Studio, so we will use ZenMate.
Ok, how to finally build such a dashboard?
1. Install ZenMate. Follow the link and click “Install”.

Click on the new icon in the browser and go to the registration page - register (you don’t have to confirm your email, and that’s how it works).

Click on the icon again and select Change location.

Change to United States.

2. Create a report
Go to the main page of Data Studio.
- Create a report- Google offers to use ready-made report templates, but they are of little use, since they do not show our target indicators (profit, conversion, calls).
- Reports- Previously created reports.
- Data sources- Connected data sources, for example, Google Analytics, MySQL and so on, more details below.

Click on the blue plus sign and “agree” to the terms.

The New Report page opens and prompts you to create a new data source. Example data sets are offered as existing sources, but we do not need them.

As you can see, almost all popular sources are available, but we need Google Analytics.
The beauty is that you can link 2 different tools with one button, since they are located inside your Google account.

- Options(in green) – these are utm_tags, regions, date and so on, that is, we are looking at numerical indicators in terms of parameters.
- Indicators(blue color) is the number of clicks, conversions, revenue, and so on.

Let's try to create a new indicator, for example, we will create a synthetic indicator "Lead" from 4 goals using the formula:
Target 1 * Target Weight + Target 2 * Target Weight + Target 3 * Target Weight + Target 4 * Target Weight
Lead = Calls (Goal 11 Completions) * 1 + Callbackhunter (Goal 3 Completions) * 0.9 + JivoSite (Goal 4 Completions) * 0.5 + Order (Goal 5 Completions) * 1.5

In the same way, we create an indicator of the cost of a lead and other usual indicators; then these indicators can be changed and new ones can be added.
Cost per lead = Cost / Lead

The most popular parameters in Google Analytics
The most popular indicators in Google Analytics:
We build graphs

After we have created the indicators, we go to the main workspace.
The first tool on the dashboard is the dates on which the report is built; by default we indicate “Last 30 days (including today)”. That is, when someone opens your report, the date will be set by default.

Now let's build a regular graph with lines.

On the right in the tab Data We see the available settings:
Data source- one table can have >1 source, for example, you can display data from several Google Analytics accounts at once for a manager or pull calls from Google Sheets.
Parameter: time parameter- for example, Date.
Index- numerical values, for example, Sessions, you can display Income, Goals, Cost or your own indicators.
Initially, it may be misleading that the axes are superimposed on one y-axis (vertical). To do this, you need to bind one axis to the left ordinate axis, and the other to the right.

Let's add a title to the chart using a text block:


Let's highlight the main indicators with a rectangle and move it to the background.

Let's add a filter to make it possible to filter the graph by source. For example, if we uncheck Yandex, the graph and indicators will be displayed only for Google.
Speaking of filters: in our case, we only need data from the “Contextual Advertising” channel. To do this, you need to add a filter at the report level. Let's go to the menu Resource > Set up filters and press Add filter


The filter works similarly to the filters in Google Analytics itself:
- Include/Exclude- we include or exclude traffic via the CPC channel in the report.
- Select Parameter/Indicator and set a condition, for example, parameter Medium (traffic channel) = CPC (type of paid traffic).
We will not go into more detail, since similar information can be found on the Internet.
Now click on any element that we want to filter. In the “Filter” field, click Add filter, where we select our new filter “Paid traffic”.

Let's add a table with conversion by region; for this we will need to create a new indicator, as we did earlier. To do this, click Add indicator in the right panel and Create new.
Clicks > Leads = Leads / Sessions

And finally, we’ll make a table on the effectiveness of managers, since our Google Analytics would be integrated with AmoCRM, which allows us to upload sales to it.

In order not to confuse report users with the English names Cost, Revenue, and so on, they can be replaced with Russian ones. Find the data source in the menu Resource > Added Data Sources and press Change.
How to give access?

We provide access to view and post a link to our report with mixed data.

How to make more complex reports
Google Analytics has limitations in collecting and aggregating data, so we use the following scheme.

1. We upload data via API from Google Analytics, AdWords, Yandex.Direct, Ya.Metrika, CRM and any other services to an application in the cloud.
2. Inside the Python application, we summarize the data into the tables we need and push it into Google BigQuery (we use it as a database).
3. Load from BigQuery into DataStudio. BigQuery is also easy to access from Pandas, Excel and other popular tools.
Note that, for all its flexibility, this is a complex solution.


Conclusion
In conclusion, let’s compare the main solutions on the market that solve a similar problem.
| Microsoft Power BI | Google Analytics Dashboards | Google DataStudio | |
|---|---|---|---|
| Sources | Everything, but for most you need to write API integration | Google Analytics only | 12 most popular |
| Auto update | You need to deploy a server in the cloud that will “push” fresh data | Automatically | Automatically |
| Difficulty setting up | High entry threshold | In the “grab and move this icon here” style | |
| Sharing | Yes | Difficult, only through Analytics | How to Google Docs |
| Advantages | Suitable for complex projects and complex reports | Easy to connect as it is inside Analytics | Solves 80% of all problems |
As a result, it can take a lot of time to prepare reports, and you can easily forget who to send what to.
SEO reports to the rescue!
And it provides such opportunities as:
connecting Yandex.Metrica and Google Analytics web analytics accounts and Ya.Direct and Google Adwords accounts;
working with Ya.Direct agent accounts;
one-time setup of the report structure for each site, which is remembered by the system;
displaying key metrics and important KPIs such as cost per lead, goal achievement, etc.;
branding of reports;
displaying data on positions through the API of such services as Topvisor, AllPositions, SEOlib and TopInspector;
connecting your own domains to send reports in html;
automatic generation of reports according to schedule.
And this is not a complete list of available functions; there are other interesting options that will be useful in your work.
Here are a few screenshots that give a clear idea of what we are talking about:
Everything is simple and clear, which is especially important for clients and owners who value information content, and not just a set of graphs and numbers.
Who needs it?
1. Specialists and agencies involved in client promotion.
2. Inhouse specialists who need regular project analytics and reporting to management.
To get started with the service, you only need to take five simple steps:
Adding your sites through web analytics accounts
We connect additional services (if necessary)
Setting up the project report structure
Press the button and wait a few seconds to receive the report.
This is relevant for any specialist who works with traffic.
And one more non-obvious point - the service is great for website owners themselves who would like to independently monitor the dynamics of the development of their project. After all, the indicators are displayed clearly and informatively, and the report designer can be configured in such a way as to receive information on those metrics that are most important for your business.
How to try the service in action
Tariffs in SEO-reports are available for specialists of any level - from a beginner freelancer to a large agency:
There is also a free demo plan that allows you to work with one website and one analytics service.
You can test the service on the paid “Freelancer” plan.
The promotional code “MOAB” gives you the opportunity to use the service for free for 2 months! The only limitation is that it must be activated before December 31st.
To use it, on the payment pagehttps://seo-reports.ru/balance/ select a tariff plan, term, enter the code in the “Coupon” field, then click the “Calculate” button:
You can register for SEO-reportsvia this link, and, I hope, the service will help you save a lot of time when working on reports and quick analytics.
I have already given an example of a report to a client.
Today I will continue the topic and provide here a “continuation” of this report.
And this despite the fact that the franchise itself cost about 1 million rubles at that time. and according to clients, the “applications for 90 rubles” that came from Direct turned out to be of the highest quality because other traffic sources, although they brought a lot of applications, did not actually lead solvent audience.
This brings me back to the question that final effectiveness is not measured in the number of clicks or even in the total amount of calls and applications received. But in real profit, which a businessman can “touch”.
Therefore, NEVER evaluate “professionalism” by secondary indicators - CTR, number of clicks, number of ads, application cost.
If your website and your sales department are “pumped up”–A “correctly” configured Direct should ultimately give you a profit.
It is better to receive 10 applications that are as targeted and motivated to purchase as possible, rather than 50 “left” or “bot” ones.
I present the report here “as is” without editing or editing so as not to spoil the overall “impression” of what I read :)
Report to the client on search advertising Yandex Direct
Your first wish was to reduce the cost of the application on the website to 200 rubles. for the application.
Let's look at the statistics on search advertising:
This was achieved through a targeted selection of key phrases and advertising texts that motivate the user to perform a targeted action - to leave a request on the site.
*Note. In addition to the design of the landing page and the advertising text on the page, the conversion of a landing page is also influenced by the text of the advertisement.
Yes, the number of applications for the search is not large - only 19 in 3 weeks, but these applications cost less than 100 rubles.
Thus, during the day we receive very high-quality filtered traffic from Yandex searches, albeit in small volumes.
As for the night search campaign, everything is much more modest:
Only 40 clicks and 4 conversions, the price of each conversion is 113 rubles.
The cost of the application is slightly higher than in the daytime, there are few applications. This is explained by the fact that at night the user is less motivated to perform targeted actions.
But the CTR at night is slightly higher, and the rate per click is lower.
This will allow us, at the end of 28 days of search advertising, to reshuffle campaigns based on time targeting.
Thus, daily applications will cost us even less.
And finally, the most interesting thing :)
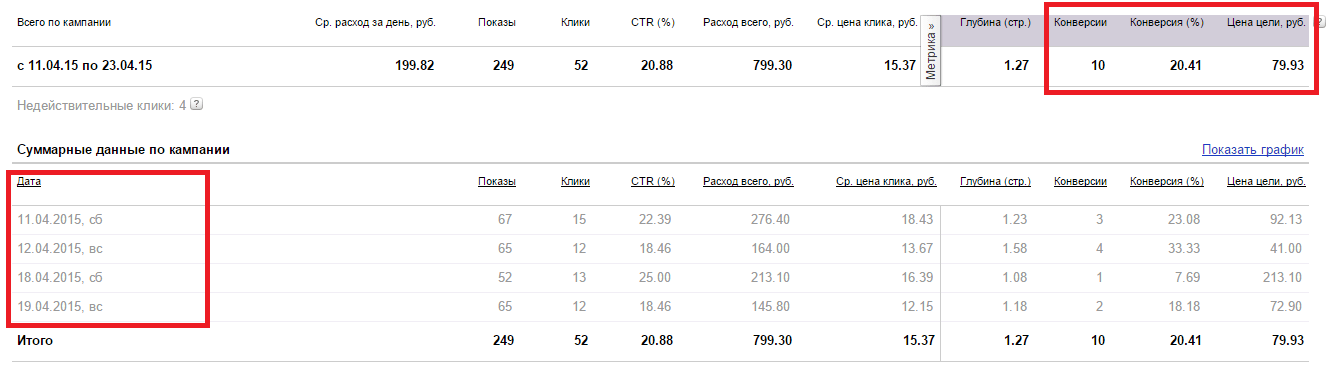
Over 4 weekends, we received 10 conversions, and each conversion cost less than 80 rubles!
Paradoxically, the cost per click on weekends, on the contrary, was HIGHER than on weekdays.
This suggests that on weekends, users are most active and “warmed up” to perform a targeted action, despite the abundance of offers on the market.
Conclusion: in total, over 3 weeks we received 33 conversions from Yandex search with an average application price of 87 rubles. At the same time, users were most active on weekends. I advise you to take this feature into account when planning your other advertising campaigns (partnerships, advertising mailings, etc.)
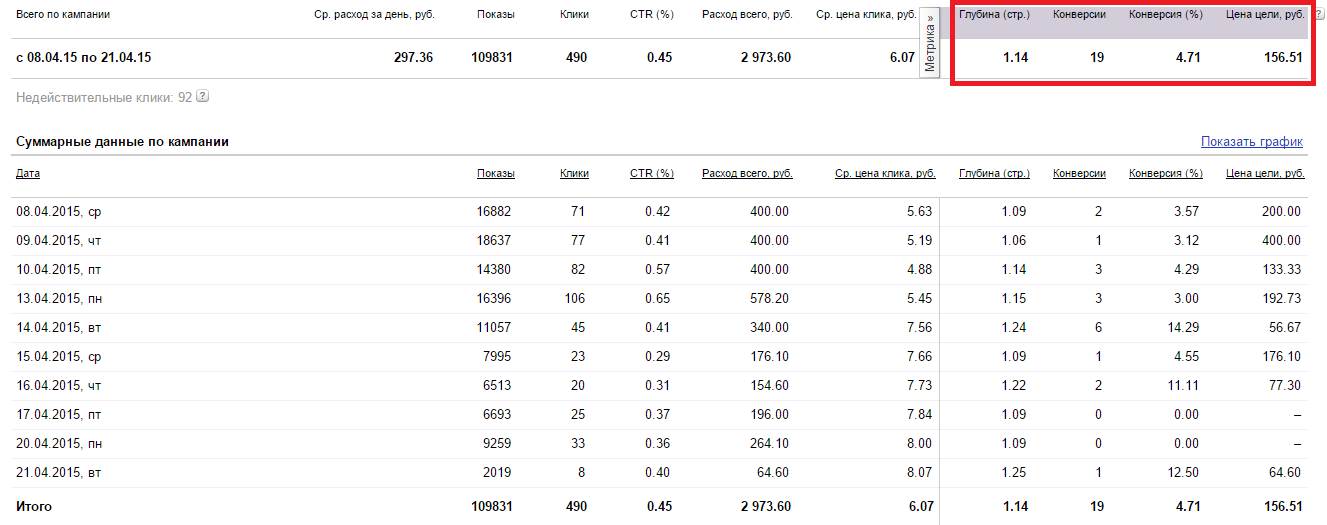
Report on the Yandex advertising network (YAN)
Having carefully analyzed advertising campaigns on thematic platforms, I concluded that, in accordance with your wishes (the application price is less than 200 rubles), it is not profitable for us to run on thematic platforms with a rate per click of more than 5 rubles.
However, if I immediately lowered the rates, we would noticeably lose in coverage (the volume of purchased traffic).
Therefore, I decided to change the approach - I created a separate advertising campaign for YAN with an expanded set of key phrases and strict filter ads, the task of which was to cut off the unnecessary target audience.
Let's see what came out of this:

In 8 days we received 682 clicks and 23 applications. The average cost per click was 3.46 rubles. and the average application price is 102.68 rubles.
Those. the application cost almost 2 times cheaper than you asked.
As for the other two campaigns with more targeted queries, let's look at the statistics for them.
Day Campaign:
This campaign brought 19 applications, the average application price was 156 rubles. The average cost per click for targeted queries is 6 rubles.
Exit campaign:

She received only 5 applications, the average application price was 147 rubles.
I disabled the night campaign with targeted queries completely, because... it generated very few clicks and virtually no conversions.
Conclusion: as can be seen from the screenshots above, on thematic platforms the key queries for which we advertise do not play a special role. What’s more important here is the correct ad text and the rates we pay for clicks. It is these parameters that directly determine how much we will pay for the client.
Overall results for advertising campaigns in Yandex
3 thousand rubles. went to VAT, 17 thousand rubles remained on the account.

Thus, starting from April 7, you spent 10,139 rubles on advertising. (excluding VAT) and received 79 applications.
Each application cost you 128 rubles.

In the future (if you continue) this indicator will improve.
A couple of notes about the landing page
In general, your site is very good, users also like it, as evidenced by the minimum bounce rates in Metrica for the “desktop” audience (Mac and Windows):

But there are problems with the mobile audience - iOS and Android users have a 2.5 times higher bounce rate:
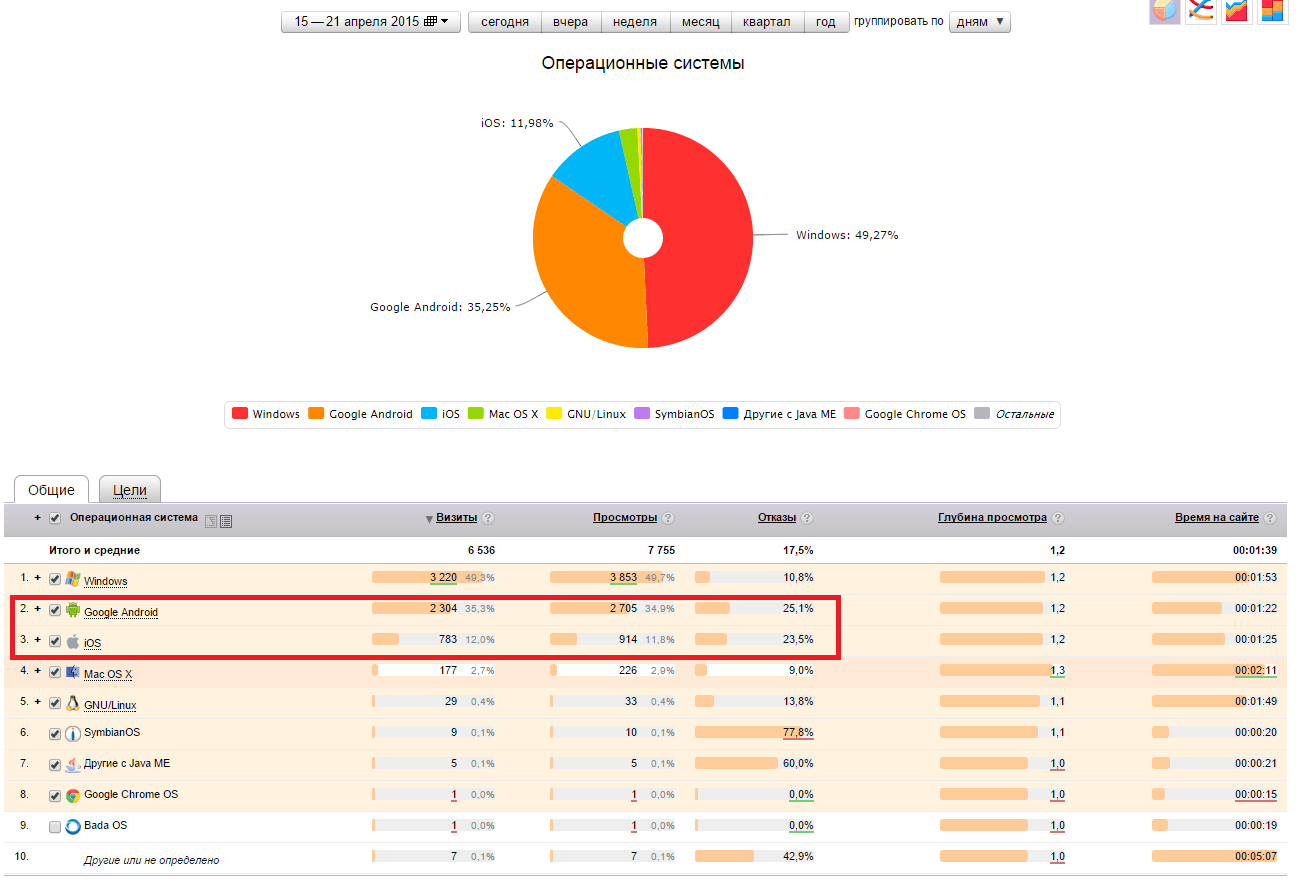
Obviously, the site needs to be optimized for mobile devices.
Also, I note that your site very often “goes down” as soon as the number of visits exceeds 500-700 per day!
As confirmation, here are the reports from Direct that came to me by e-mail:

The letter itself:
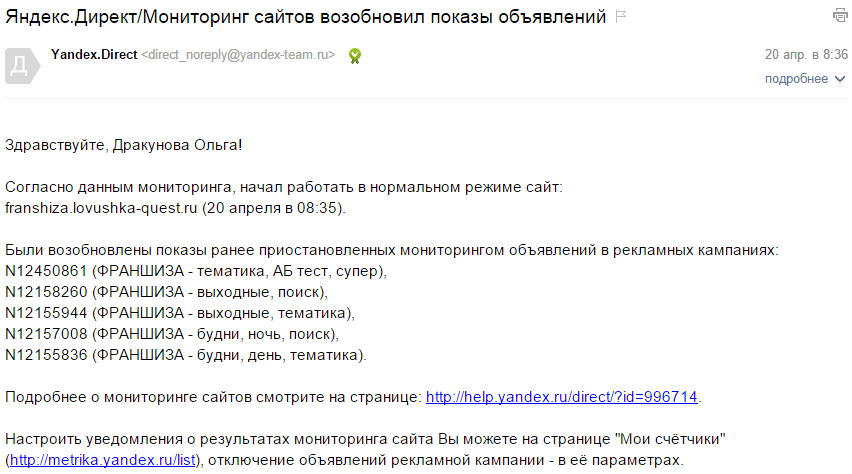
And although Direct (like Adwords) automatically stops advertising after the site goes down, it can take up to 30-40 minutes from the moment of activation to stopping.
Think about how many clicks can go “into emptiness” during this time...
That's all for now.
If you have any questions, write to me on Skype: direct-profit or by mail: [email protected]
Best regards, Dmitry.
We've released a new book, Social Media Content Marketing: How to Get Inside Your Followers' Heads and Make Them Fall in Love with Your Brand.
Advertising reports can become a big problem. They are difficult to make and preparation takes a long time. And the things that the client wants to see and that the analyst can provide often do not intersect at all. It is sometimes simply difficult to cover the entire volume of data in one piece of paper.
We often find ourselves thinking that it would be nice to improve reporting systems, create ready-made templates, and develop universal methods for analyzing data on advertising campaigns. But all this takes time. Don't know where to start.
Good customer relationships are based on trust. It is based on how to define and measure success. [For each client, you need to find the metrics and indicators that are important to their business. The customer must understand what he will receive as a result of the work of the advertising campaign, and the analyst and Internet marketer must put success indicators into this data].
Reporting is one of the ways to interact with the client. It's not enough to be able to tell stories. You need to be on the same page with the client. Today we’ll talk about how to achieve trust and draw up informative reports on online advertising.
Internet marketing has already emerged as a separate field. It has its own abbreviations, abbreviations and indicators that the client does not know about. Therefore, below we will talk about ways to achieve mutual understanding with the client in reporting documentation.
1. Honesty and consistency
Numbers never lie. But they can mislead a person - talk about something that actually does not exist and will not happen.
The first feature of a good report is honesty and transparency. It doesn't matter whether the advertisement brings in leads or not. Just talk about what's happening.
When you provide your client with correct data for each reporting period, trust arises between you. So just be honest about what works and what doesn’t.
Let me make an important note. If in one report you provide information about some indicators, and in the next - about completely different ones, the result will be bad. Maintain uniformity. To do this, prepare a report template and agree it with the customer. Discuss whether it will be easy for him to navigate.
Report results regularly. Agree on a reporting schedule. The client will have fewer questions, and you will have more time to work, and not to spend time on educational programs. The customer himself will figure out what to expect and when.
2. In the report - from general to specific
Organize your report from the main to the details. At the beginning, provide a summary of what you did. Then provide statistics. Below it, insert ad groups with key phrases. The customer can easily figure out what's what.
Surely you have clients who do not move beyond the first page of the reporting document? For others, on the contrary, take out and put in all the ins and outs of your work.
The method of organization we propose will appeal to both. If the customer does not want to dive headlong into the report, he will stop after the general information. If he wants comprehensive information, he will continue reading.
3. Start with goals
The specialist really wants to start the report with the metrics he is working to achieve:
- shows;
- clicks;
- conversion;
Of course, the employee wants to brag about the achieved results to the customer. But a business owner thinks on a larger scale. And general performance indicators are important for him:
- ROI - profitability of the Republic of Kazakhstan;
- ROAS - gross income from the Republic of Kazakhstan (the ratio of the Republic of Kazakhstan's profits to expenses).
Place information that is significant to the client at the beginning of the report
4. Add a dashboard or summary
Remember: the customer can show your report to a person who does not understand anything in terms of online advertising.
So make a dashboard that shows overall results. Describe them in words and place them close to the beginning of the report. The client will ask fewer questions, even if he shows your report to someone else who doesn’t understand online advertising at all. The customer will see what is happening with his business: whether your advertising is helping to increase sales.
If the report starts with the client's goals (and not with PPC metrics) - and tells general information, then this dashboard will fit perfectly into this place.
Use all the information you have to answer the client's questions. Most often they are like this:
- Will advertising achieve business goals?
- what strategy are you using?
- What about the media plan anyway?
- Maybe we can compare the report for the previous period?
Decipher all information to the client. And he will make sure you succeed.
5. Define
If you use abbreviations and complex terms, explain to the client in simple terms what they mean.
Provide footnotes for each difficult term or prepare a universal glossary section for clients. And no one will blame you for considering the customer a schoolboy.
By continually providing these definitions, you will educate the client with each report. He will have fewer questions, and he will become better oriented in detail.
6. Divide KPIs into different types of interaction
Not all keywords convert. Model attributions, guide the client through your report.
Separate different conversion segments in your report. It increases not only because of your actions.
Think about how to reflect the sales funnel of the business you work with in your report. Determine the journey that the customer's consumer takes. Thus, you can separate brand queries from commercial ones, include conversion data at each stage of the funnel, and divide the audience into segments according to different conditions.
Your customer should easily understand how advertising works in each segment of his target audience.
7. Summarize everything you can.
Google AdWords does a great job of providing statistics.
There are communications that can get lost. For example, Google does not see phone calls. If you don’t want to miss them, include them as a separate item in the report.
Combine the data, draw a beautiful picture that will explain the state of affairs in your fingers. The customer will immediately see and understand everything.
8. Detail the report
Reports are used in meetings, brainstorming sessions and building new marketing strategies.
For example, in the studio we use reports as a reason for another call to the client. We discuss details with him and receive feedback on our work. Some clients want to see statistics for each keyword and impression. And some people just need reassurance that everything is fine.
Even from those who have enough general information, we need feedback on detailed elements of the report - for example, ad texts or semantics. But they take up a lot of space in the report. Therefore, it is better to place them at the end or even place them in a separate application document.
9. Add non-internet marketing data
In many customer relationships, PPC conversion is the primary measure of success. This is a sign of closing a deal, which shows the income itself and its source.
Work with the sales department, ask the client for access to CRM. Point out the increase in leads and increased user activity on the client portal. This way you can better describe the result of your efforts.
At least you will have feedback from the customer. You will be able to manage the Republic of Kazakhstan in real time, and not wait for the approval of dozens of ad texts or angry letters saying that you have broken everything.
Get the data as quickly as possible. This way you will avoid a situation where, from your point of view, everything is going as it should, but your customer’s contracts fall through.

Ivan Tseluev
Making a report template is difficult only in theory. In practice, it is enough to follow a simple scheme: glossary - promised results - results obtained - conclusions. And you will get a simple and informative report. You should not overload it with unnecessary metrics, this will only confuse an unprepared client.
The point is that once you create a template, you will forget about it and will make all subsequent reports based on the ready-made template, only occasionally supplementing and adjusting it.
It is also worth taking care of the visual component of the report. Add graphs and screenshots, make beautiful headers and footers and work on the overall design of the report. The client will be doubly pleased to read your report if, in addition to good indicators, it is stylishly designed.